DSLR & Mirrorless
  3D Camera
  Drone & Action camera


Stab series : How to Create and Use Realistic Movements for Stabilization Testing? (3/3)
Accurately evaluating image stabilization requires reproducing how people truly use and therefore shake their devices. At DXOMARK, this process begins with capturing real-world user motions using a professional-grade orientation sensor that fuses data from the gyroscope, accelerometer, and magnetometer. Using internal processing, these signals provide a stable, accurate, and continuous estimation of the device’s angular position over time with minimal noise. This is exactly what DXOMARK needs to record and recreate clean and realistic motions for stabilization testing.
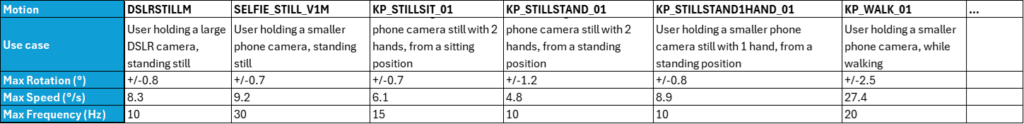
From these recordings, DXOMARK builds a set of representative motion profiles that reflect common shooting scenarios: still photography while seated or standing, one-handed phone use, slow to fast walking, running, and more. Each motion is then characterized by its angular ranges, maximum rotations, average and peak angular velocities, accelerations, and dominant frequencies.
These parameters are essential for faithfully reproducing human movement on the H840 and H860 hexapods, ensuring controlled and fully repeatable testing conditions
The characteristics of a motion, such as the walking motion (KP_WALK_01), can be illustrated using these three graphs.
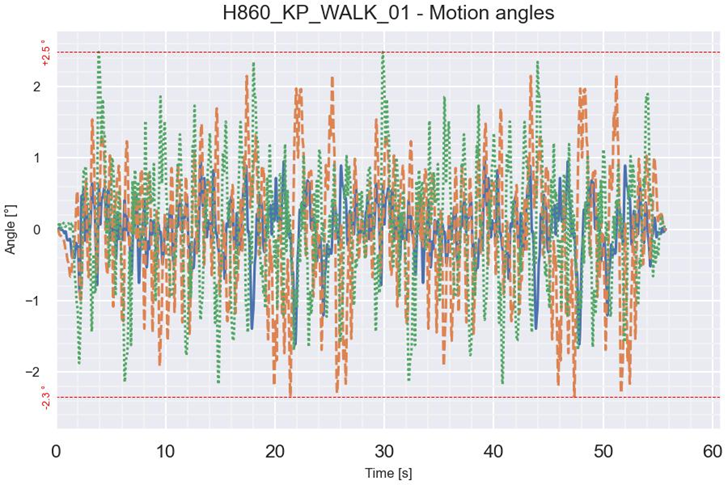
The first plot shows the device’s angular position over time along the three axes (pitch, yaw, and roll). A walking motion generates rapid, irregular oscillations typically between ±2 to ±3 degrees, corresponding to natural arm swings and small movements.
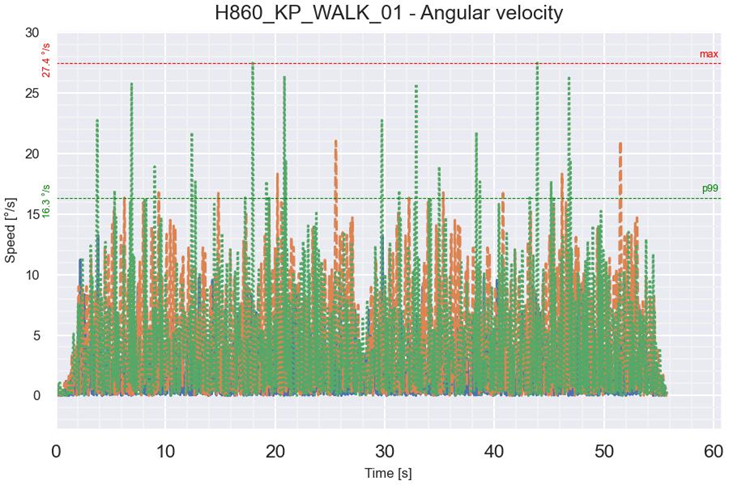
The second graph displays the rotation speed of each axis. Walking introduces frequent peaks in angular velocity, often reaching 10–20°/s, reflecting the rhythm of hand movement during motion. These values help characterize how “dynamic” a motion is.
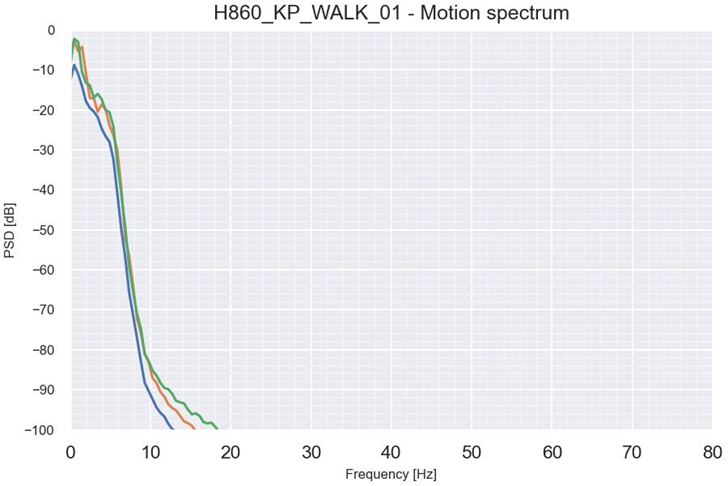
The third graph, the motion spectrum, shows how the motion energy is distributed across frequencies. Most of the energy is concentrated below 10 Hz, which is typical of human motion. Higher frequencies are filtered out to reduce the risk of exciting resonance modes in the device’s OIS system. Limiting high-frequency energy ensures safe operation and guarantees that the reproduced motion remains representative and stable.
Together, these graphs demonstrate that the recorded walking motion is authentic, well-characterized, and corresponds to a real walking motion. All these motion characteristics define the mechanical specifications of the stabilization platform should cover. This ensures realistic, accurate, and repeatable stabilization evaluations.
By combining real user motion capture, precisely reproduced hexapod movement, and a unified chart-based analysis, DXOMARK delivers stabilization evaluations that are consistent, repeatable, and aligned with real-world behavior. This approach helps manufacturers optimize their technologies and provides users with a clearer understanding of how stabilization systems perform across different scenarios
Both photo and video stabilization are evaluated using the same Texture Chart. After detecting the chart’s markers with sub-pixel accuracy, DXOMARK identifies the grey patches, SFR edges, and Dead Leaves texture needed for measurement.
For photo stabilization, the system measures motion blur through a texture-based MTF analysis. Instead of a single blur value, the MTF is computed in four angular sectors of the FFT, revealing not only the amount of blur but also its direction. The goal is to determine the longest exposure time that maintains acceptable sharpness under a given motion profile, defined according to the application.
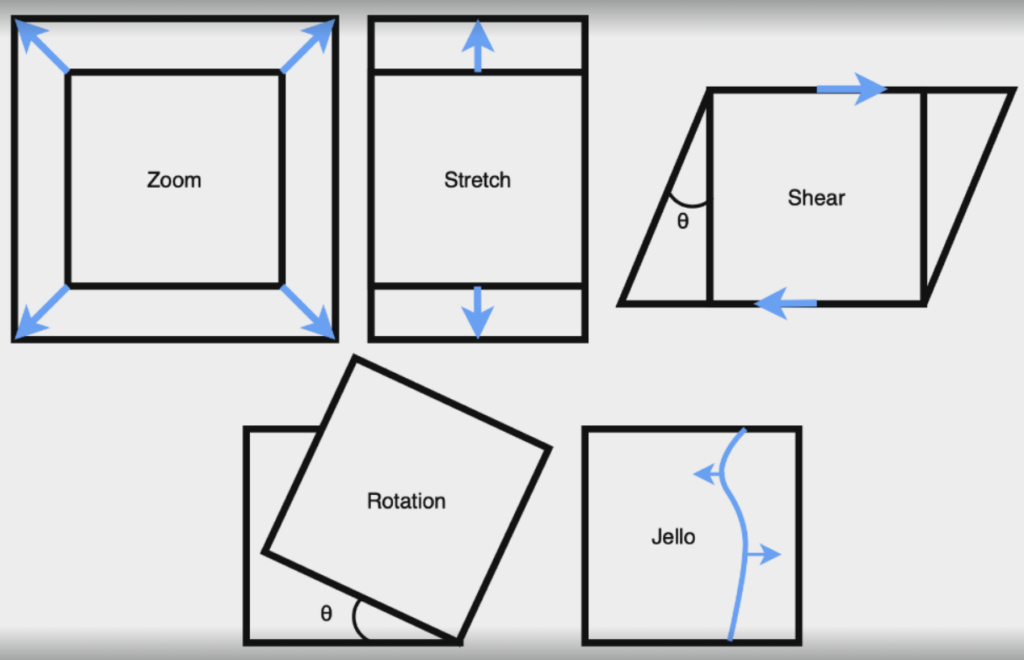
For video stabilization, the marker positions are used to quantify global motion and rolling-shutter-related distortions. This includes translations, rotations, zoom changes, shear, keystone deformation, and the characteristic “jello” effect caused by CMOS readout. These metrics describe how well a stabilization system keeps the scene steady and geometrically coherent across frames, and should be process using the motion profile relevant for the camera.