 DSLR & Mirrorless
  3D Camera
  Drone & Action camera

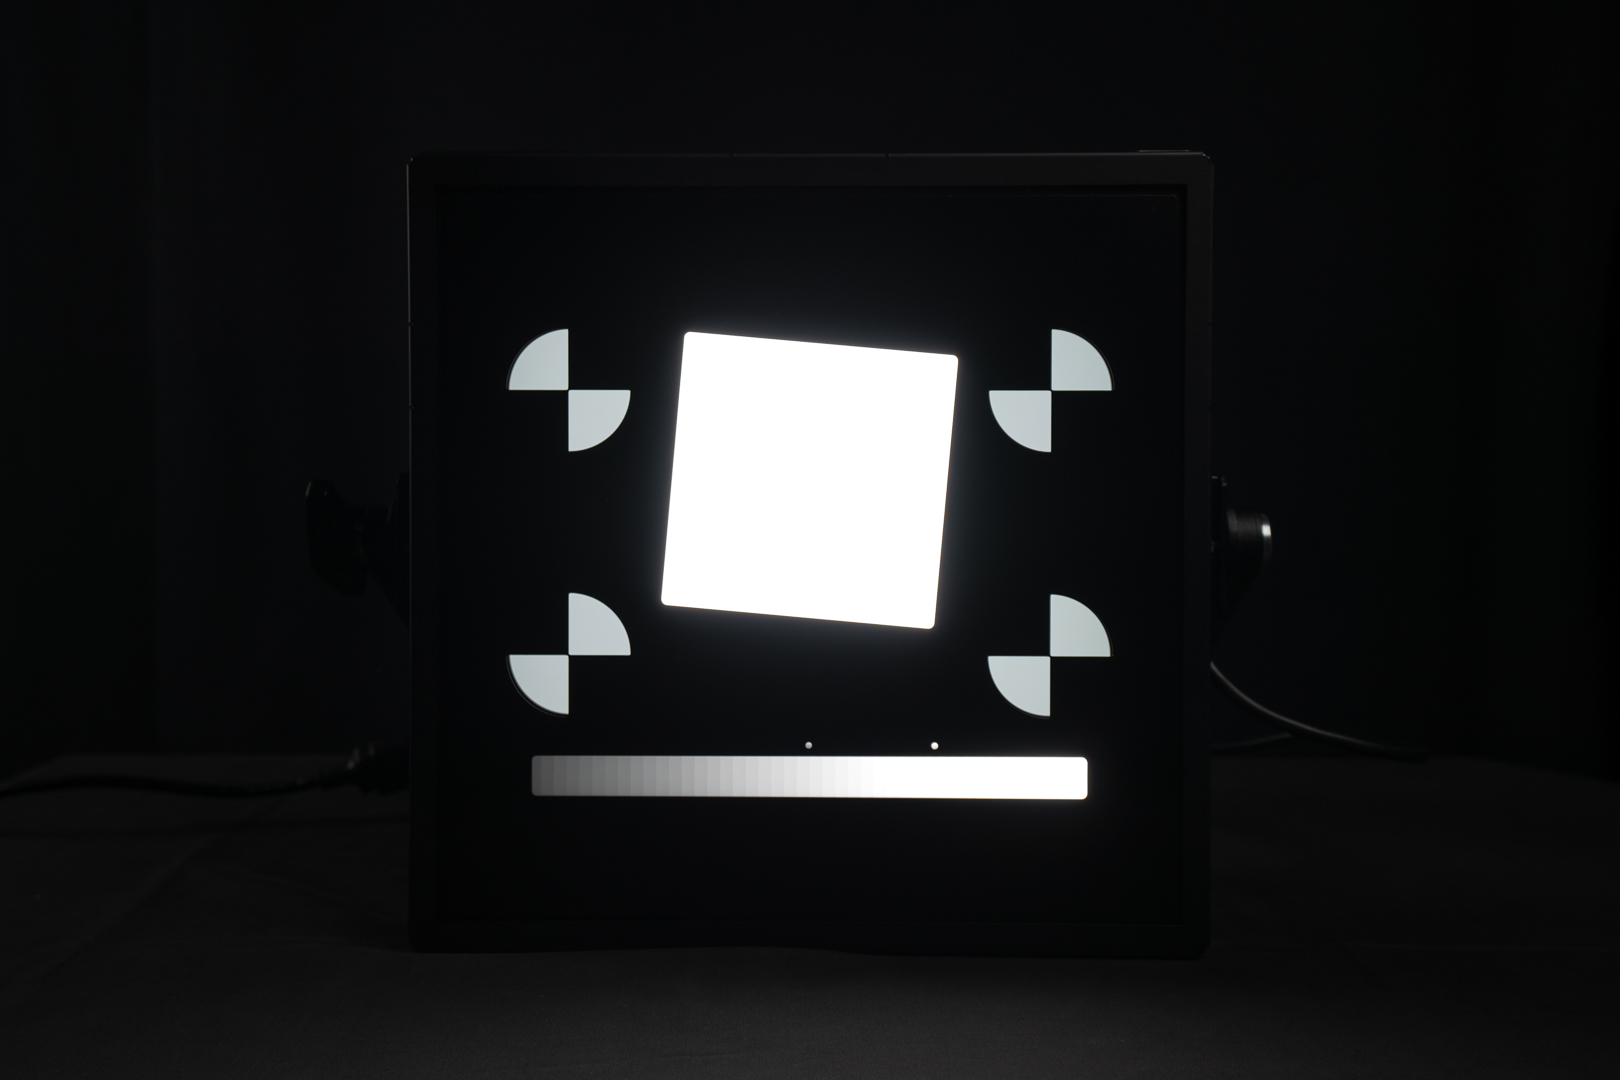
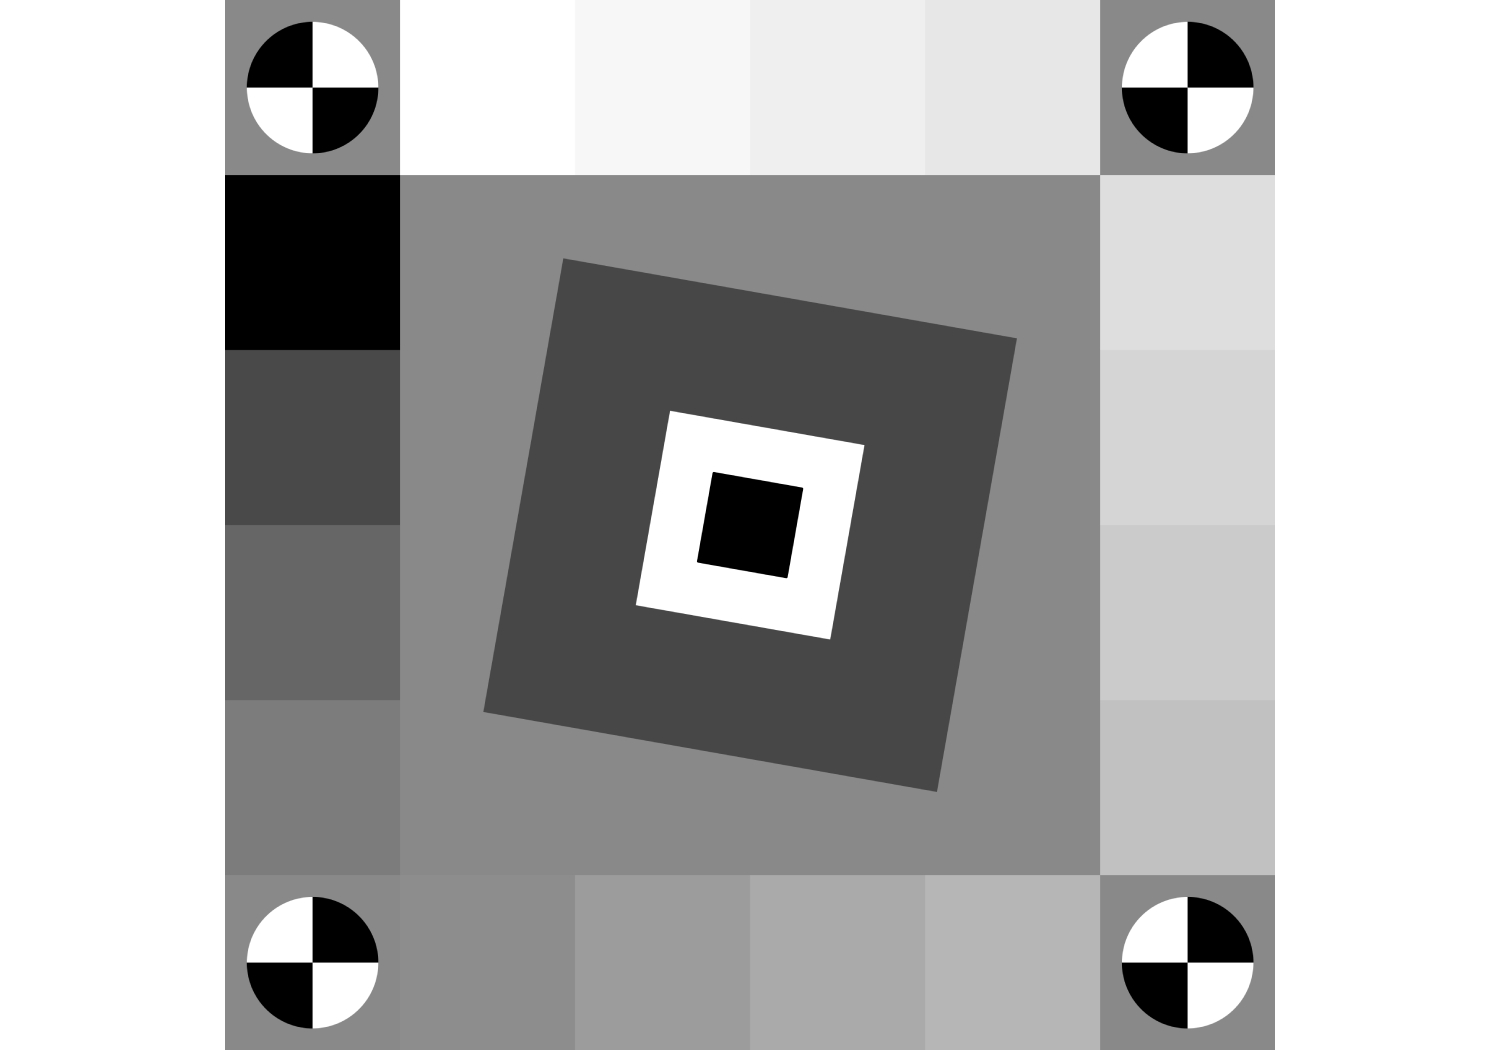
This transmissive chart consists of a square pattern positioned on a uniform light table. You can use thi...
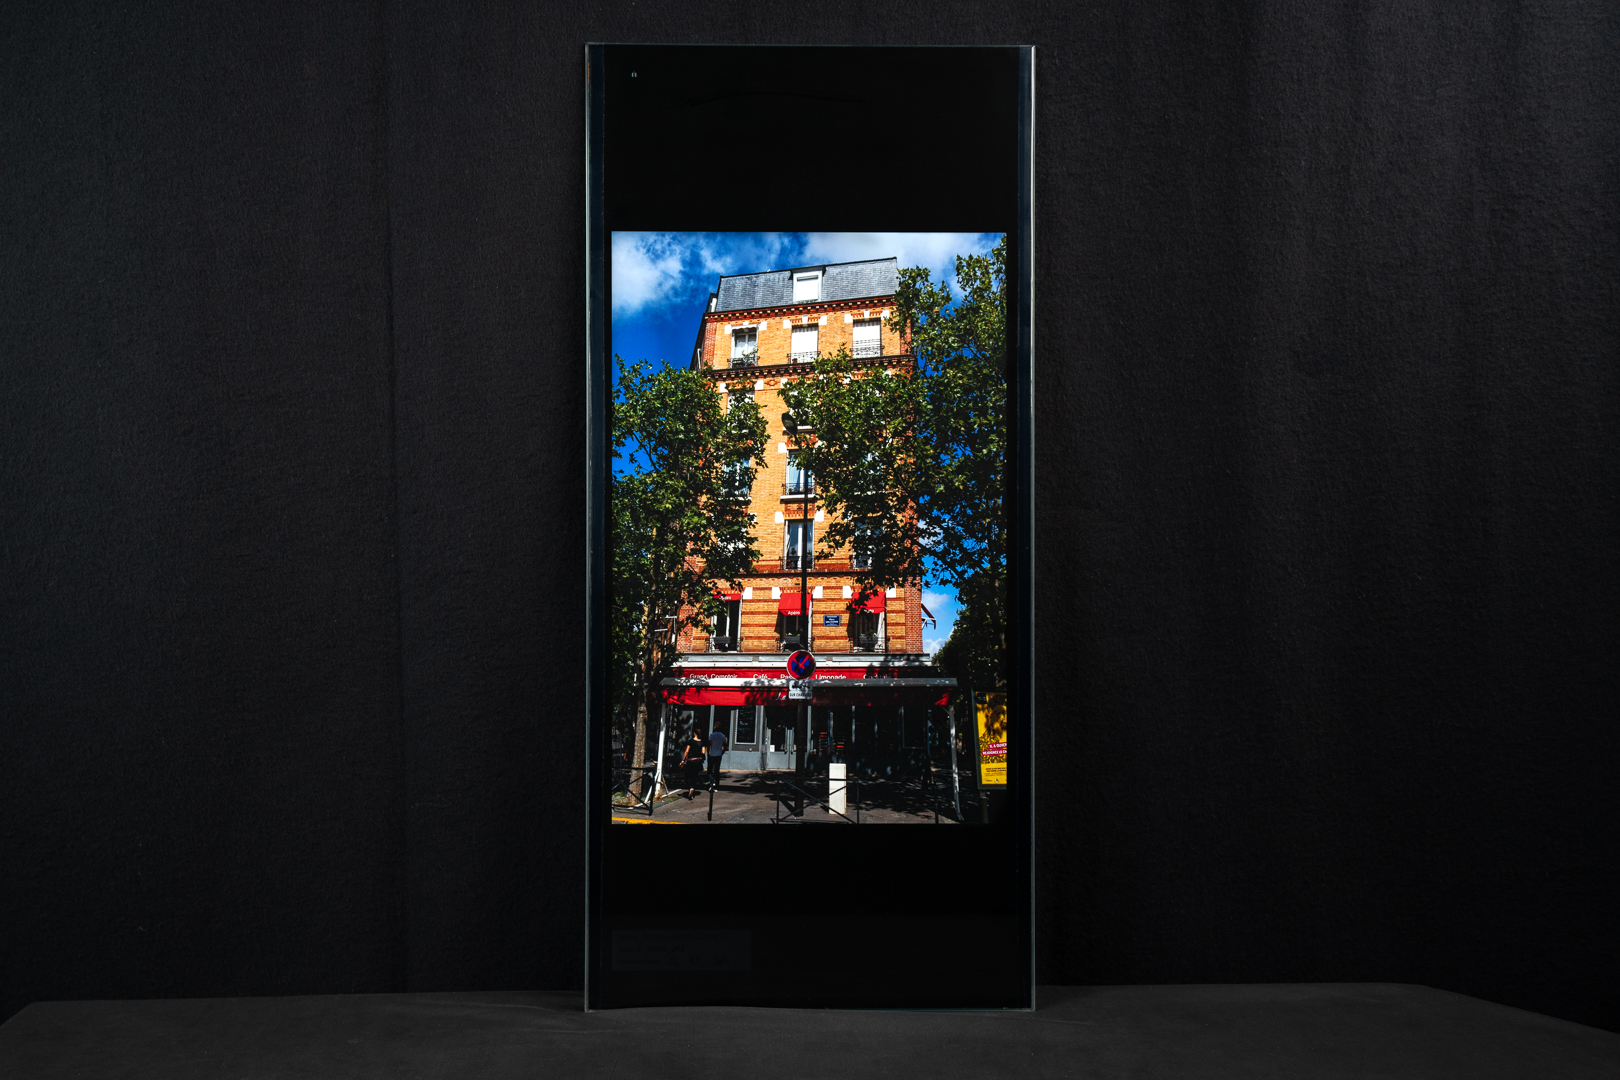
Containing a detailed real-life scene for performing lab-based perceptual analyses under controllable HDR...
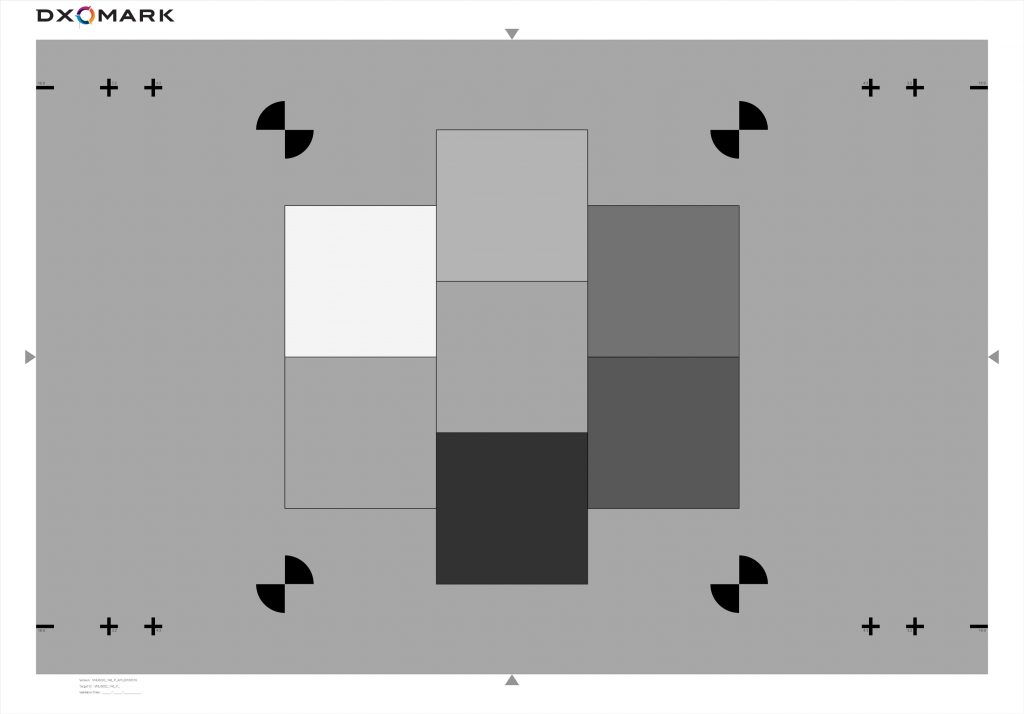
This chart is composed of seven large grey patches designed specifically for measuring visual noise for v...
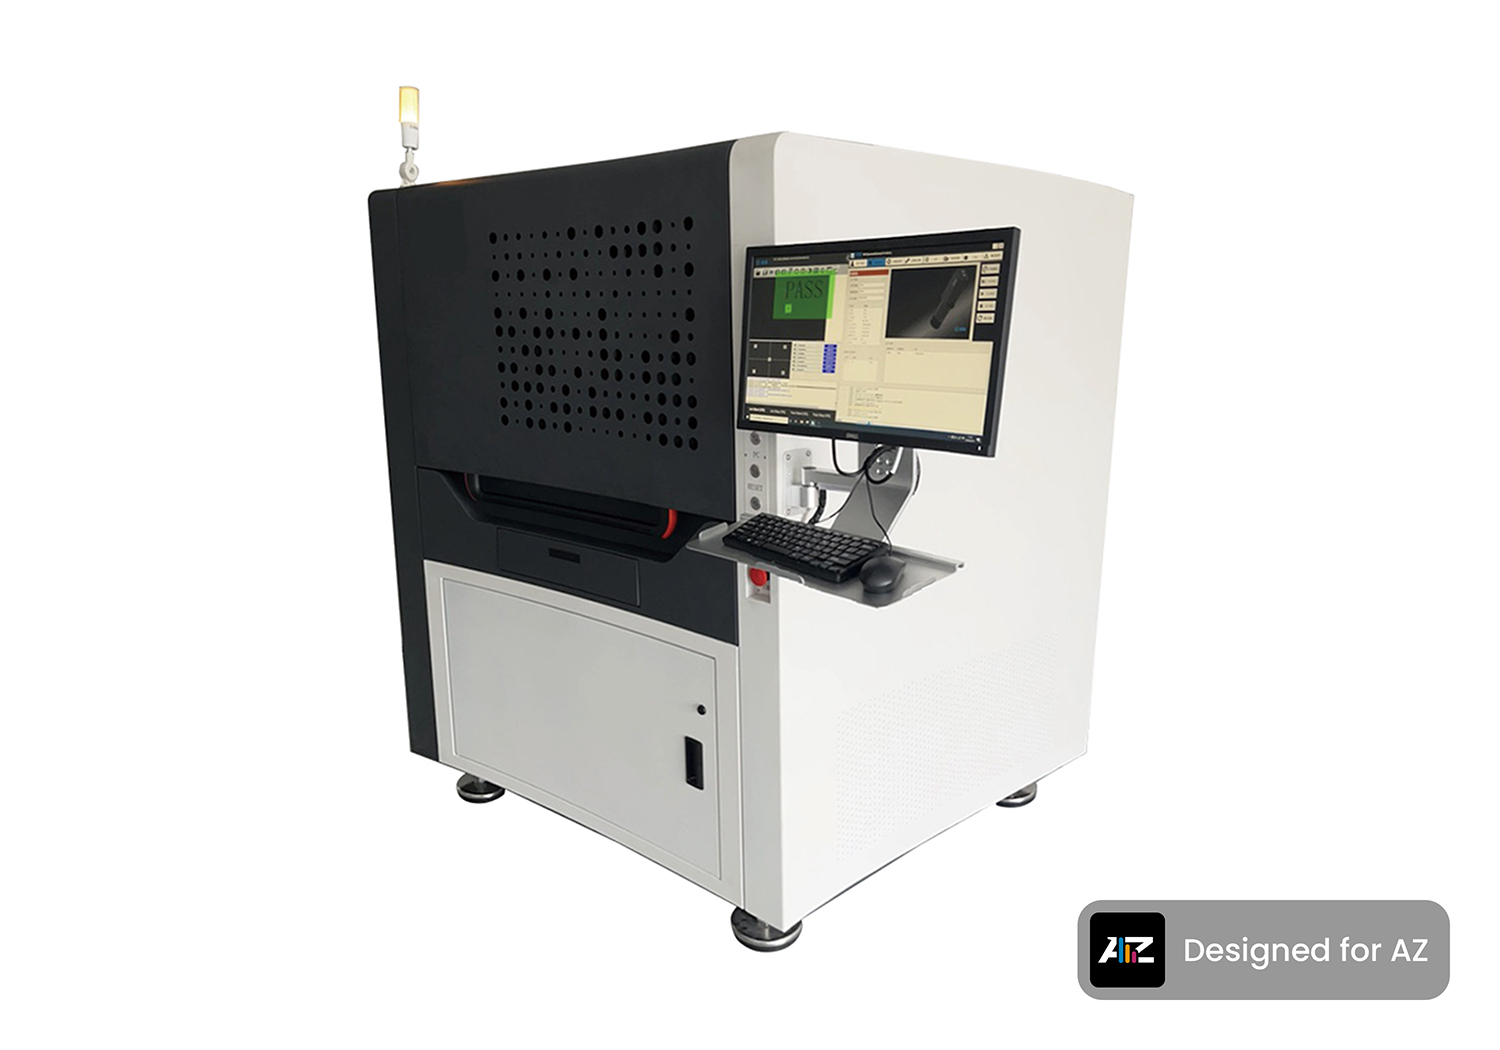
Autofocus testing requires defocusing multiple times during each photo session, which can be tedious and ...
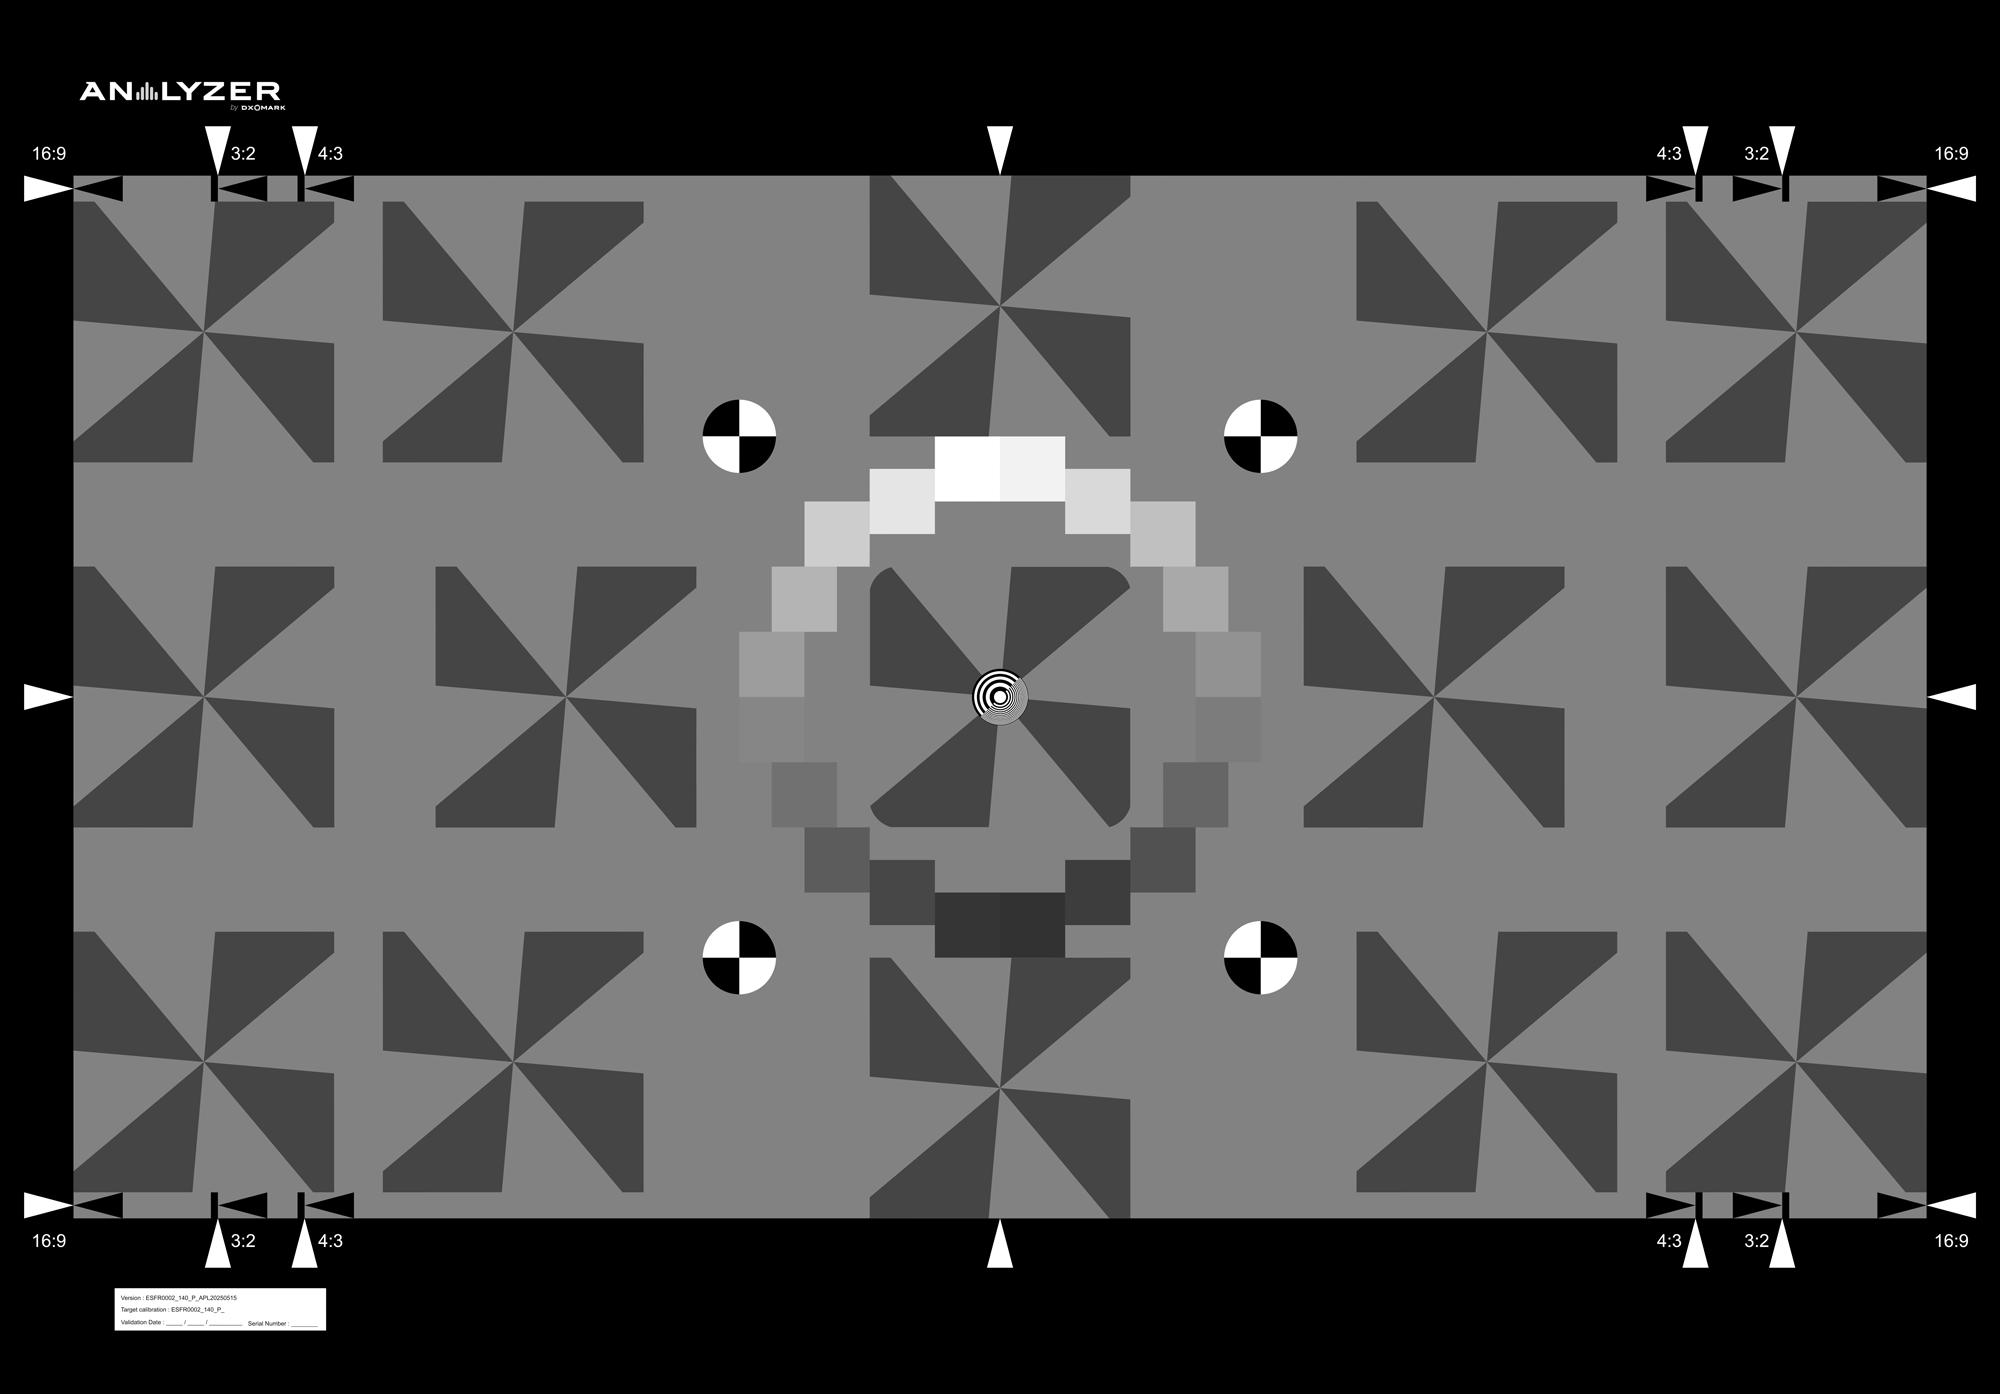
The e-SFR Chart delivers precise SFR / MTF measurements for lenses, sensors, and complete imaging systems...
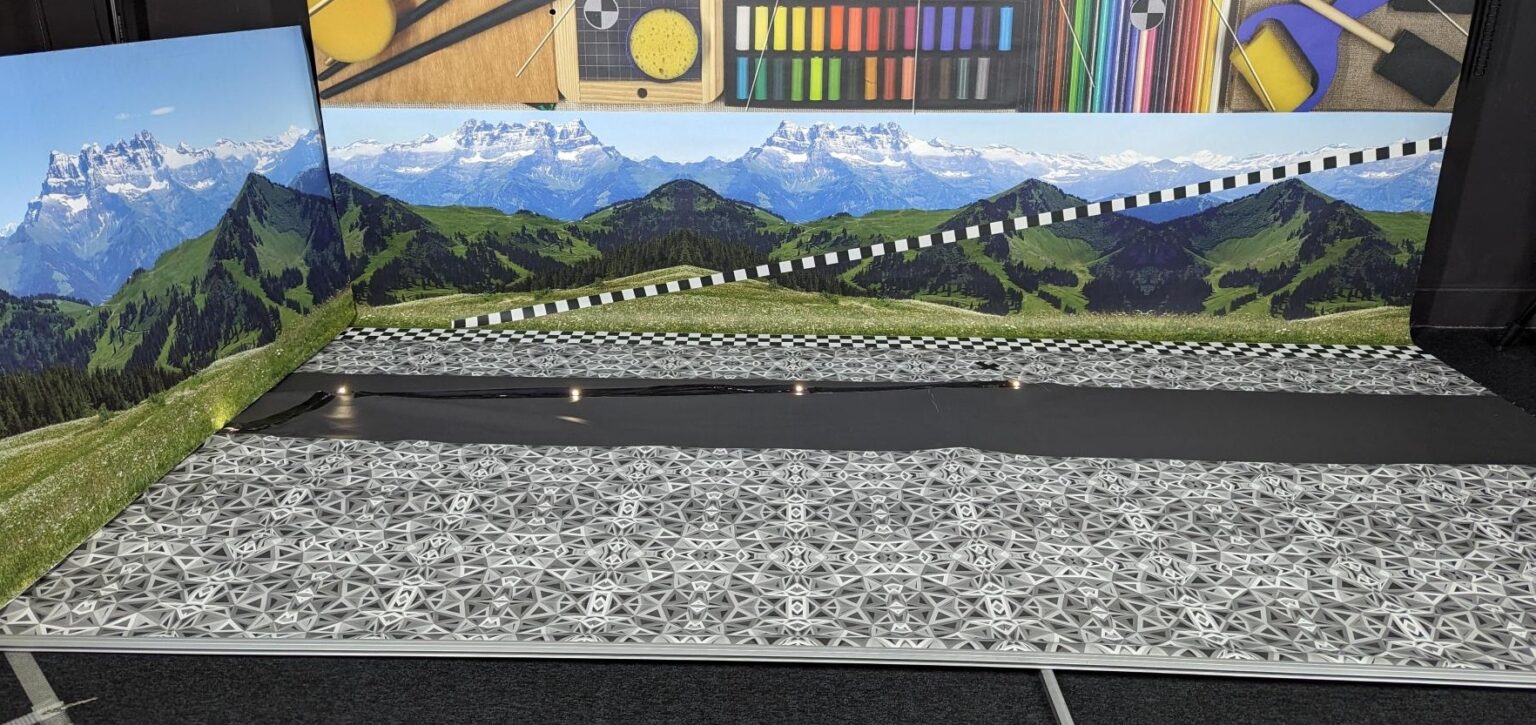
Resolution is a key factor in evaluating cameras and lenses. However, flat test charts can lead to subpar...
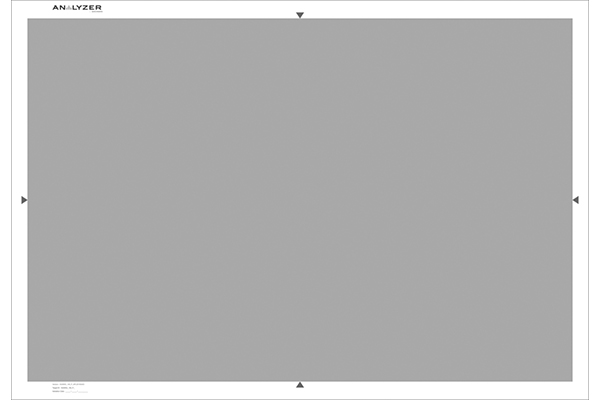
This uniform grey-colored chart is designed for evaluating exposure, shading, defective photosites, flash...
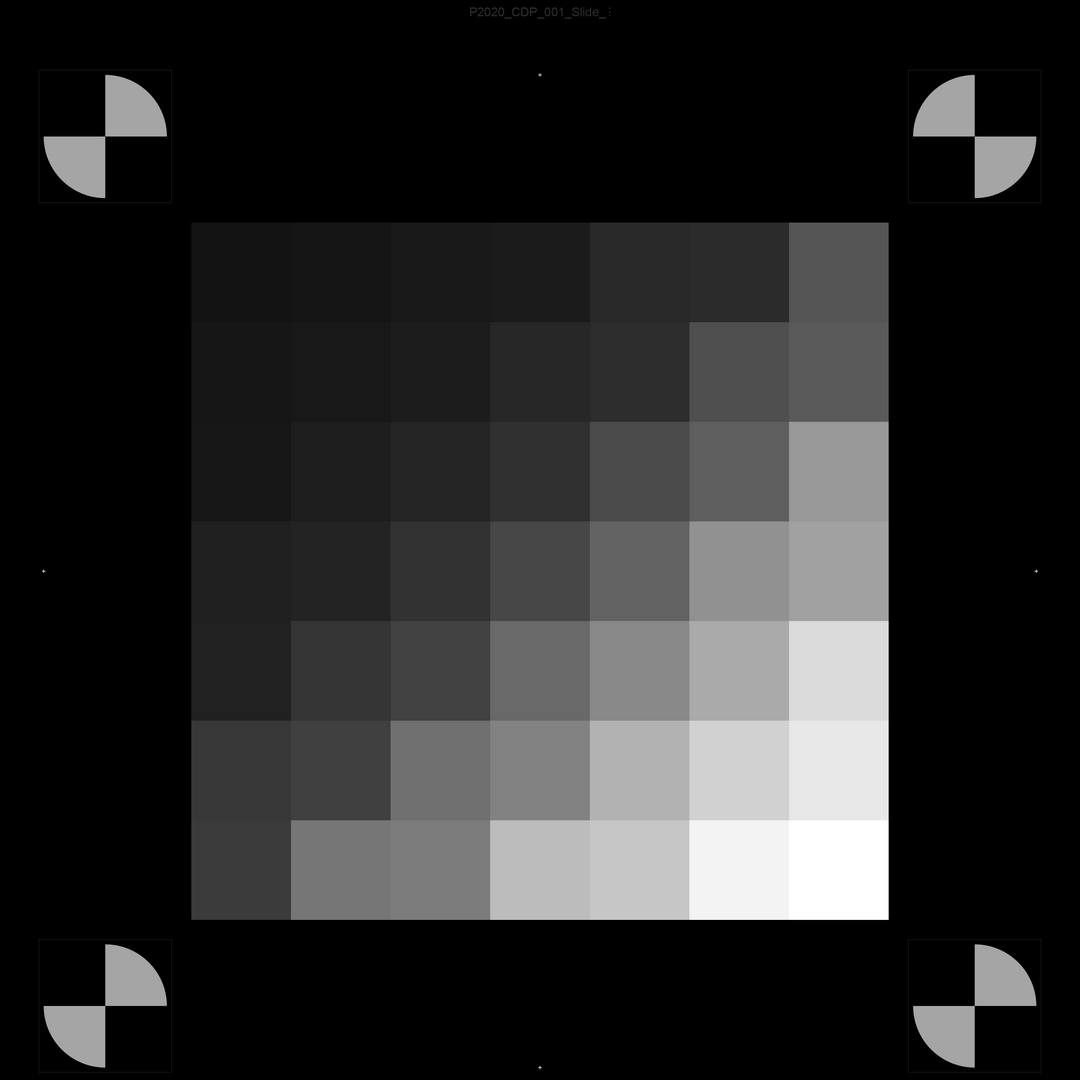
The Contrast Chart is specifically designed to meet the requirements of the IEEE P2020 standard for autom...
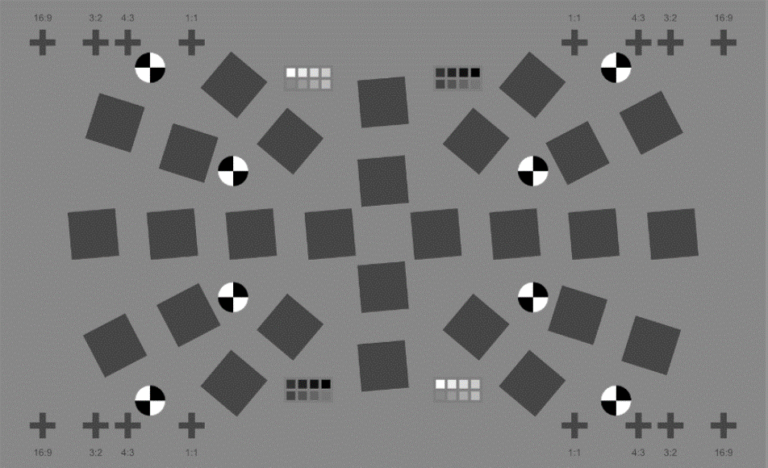
An ISO 12233 and IEEE-CPIQ P1858 compliant, low-contrast chart that delivers radial sagittal & tangen...
SFR chart is designed to meet the latest IEEE P2020 standards for spatial frequency response (SFR) measur...
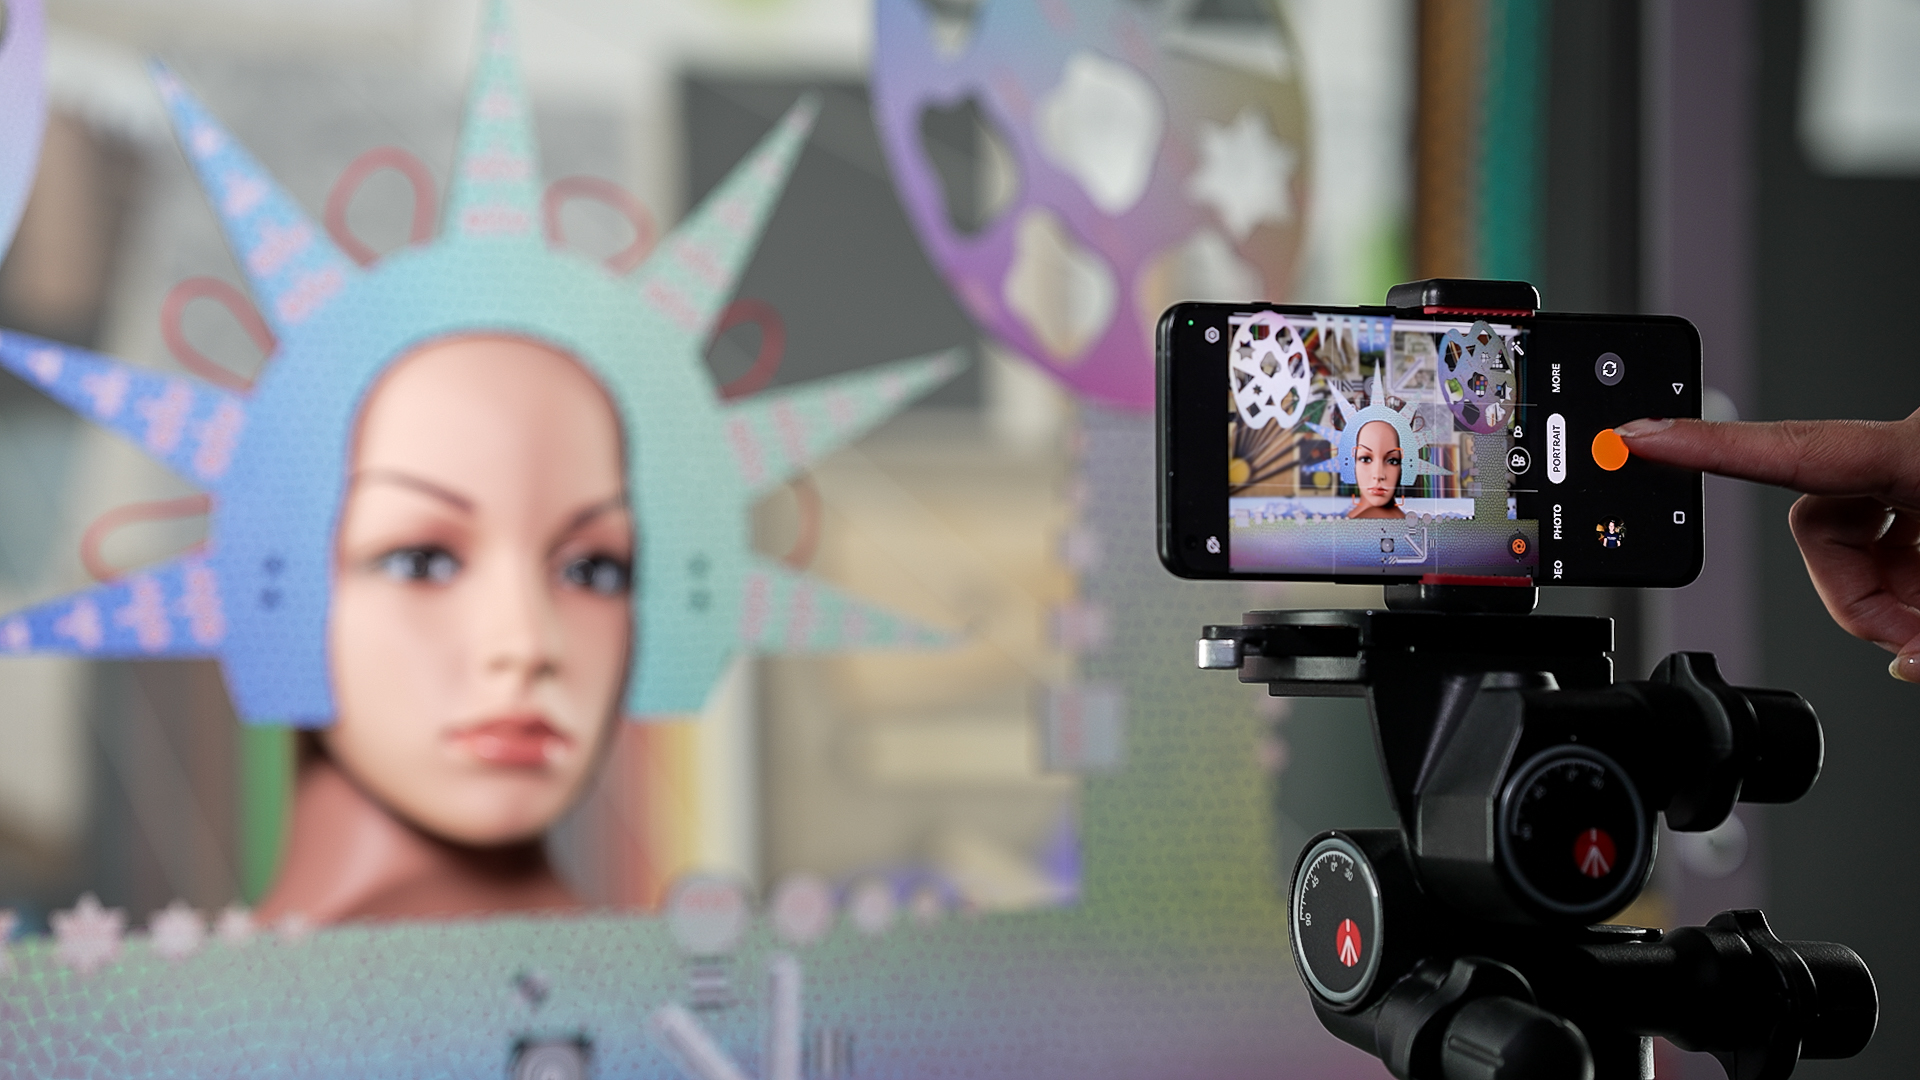
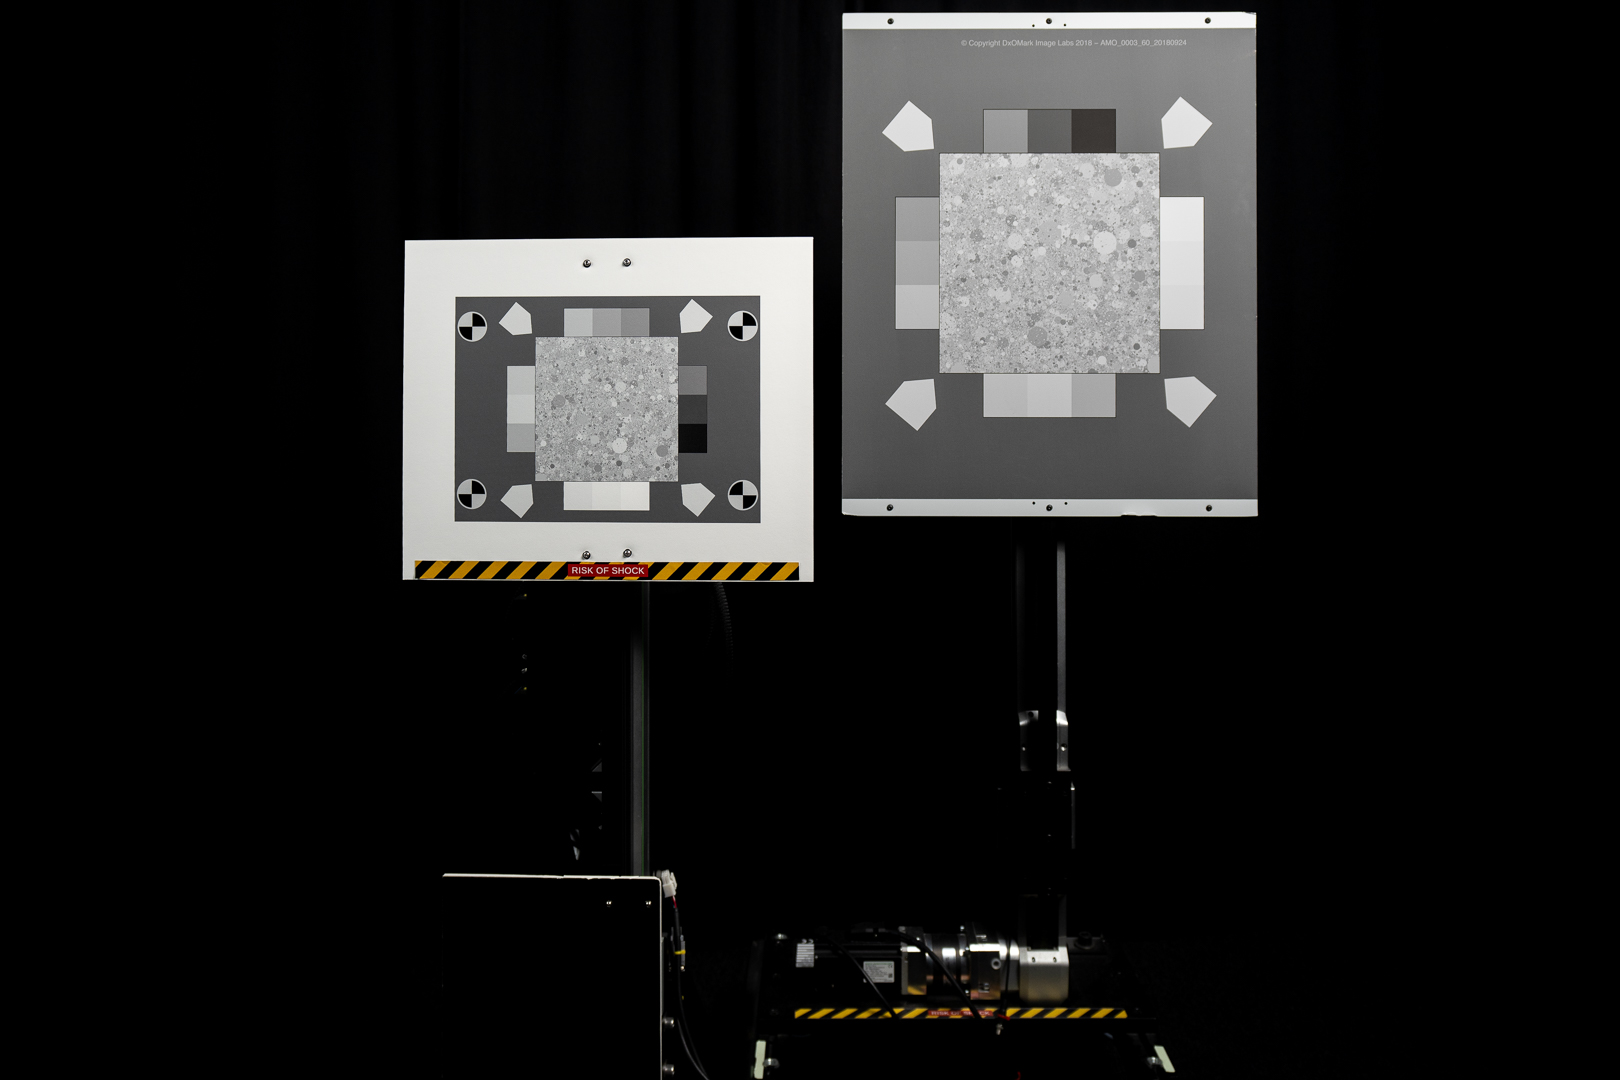
Evaluating the quality of a device’s computational bokeh requires a lab setup that ensures accuracy and...
To analyze the quality of bokeh blur, DXOMARK has developed a setup with two planes — one on the right ...