DSLR & Mirrorless
  3D Camera
  Drone & Action camera


Measurement descriptions
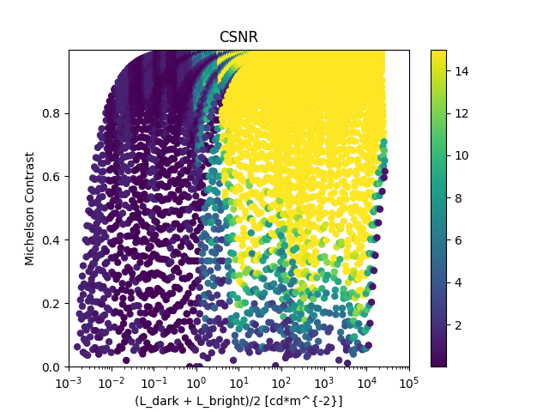
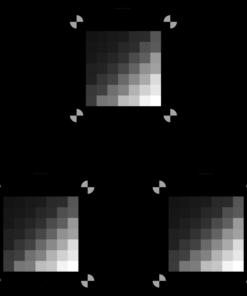
These two contrast performance indicators assess a camera system’s ability to detect and differentiate between varying levels of contrast. The metrics ensure that the device can distinguish contrast at any luminance level and under various intensity and contrast conditions, ultimately generating a performance curve.
Contrast Transfer Accuracy (CTA):
It measures how faithfully the contrast between a pair of patches in the captured image matches the reference scene. It quantifies the system’s ability to preserve contrast accurately. A CTA value close to 1 indicates a high level of fidelity to the original scene contrast.

Contrast Signal-to-Noise Ratio (CSNR):
It evaluates the system’s ability to detect contrast in the presence of noise. It reflects how well the camera can distinguish between two patches despite noise. A higher CSNR indicates a stronger signal relative to noise, meaning the contrast is more clearly perceived by the camera.