As HDR is increasingly used in photographic, video surveillance, and ADAS devices (among other applications), brands and manufacturers need to assess their devices’ HDR performance and tune them accordingly. Analyzer’s HDR Module includes a Composite chart for use with automated and controllable lighting so you can measure such essential HDR attributes as color, texture, and contrast in one shot. It also contains a Natural Scene chart for perceptual analysis to complement Composition chart measurements, and an HDR Noise chart for dynamic range and noise analysis.
HDR Tone Mapping – Composite charts
This setup is composed of two Gemini with their Composite charts. The composite chart contains three main patterns — grayscale, 24-color matrix, and dead leaves. The setup lets you verify your camera’s ability to consistently reproduce colors, manage noise, and preserve contrast and texture in comparison with an objective reference. Using recommended lighting, you can simulate a dynamic range of up to 15 EV in the test scene.
Key metrics:
- Tone mapping
- Dynamic and tonal range
- Signal-to-noise ratio
- Dark signal
- Tone curve
- ISO Sensitivity
- Artifact analysis: texture loss, moiré, aliasing, color shift
Texture preservation:
- Texture MTF and acutance
- Edge MTF and acutance
- Visual noise at 50%
- Exposure (grey level at 18%)
Contrast preservation:
- Histogram
- Entropy for each channel
Color consistency:
- Color fidelity
- White balance
- Metrics: ∆L, ∆a, ∆b, ∆ab, ∆E, ∆C, ∆H
Links to accessories and lighting:
- Composite charts (CT002)
- Litepanels Gemini 2×1 LED Panel (GEMINI_002)
- Multispectral Lighting System (MLS_SUNIR_001)
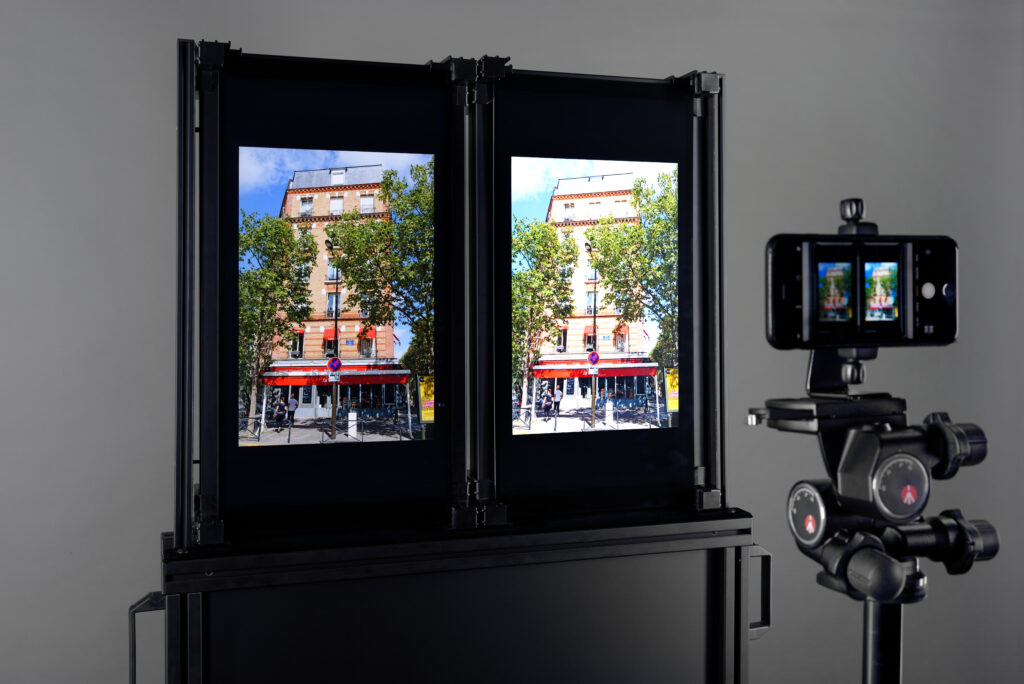
HDR Tone Mapping – Natural Scene charts
This setup is composed of two Gemini with their Natural Scene charts. This detailed real-life scene is used for performing lab-based perceptual analyses under controllable HDR conditions. It also facilitates evaluation of texture loss, moiré, aliasing, color shift, and sharpness.
Links to accessories and lighting:
- Natural Scene charts (NS002)
- Litepanels Gemini 2×1 LED Panel (GEMINI_002)
- Multispectral Lighting System (MLS_SUNIR_001)